Note
Click here to download the full example code
Explaining Local Classifier Per Level
A minimalist example showing how to use HiClass Explainer to obtain SHAP values of LCPL model. A detailed summary of the Explainer class has been given at Algorithms Overview Section for Hierarchical Explainability. SHAP values are calculated based on a synthetic platypus diseases dataset that can be downloaded here.
Out:
<xarray.Dataset>
Dimensions:          (class: 15, level: 3, sample: 246, feature: 9)
Coordinates:
  * class            (class) <U16 'Allergy' 'Bee Allergy' ... 'Respiratory'
  * level            (level) int64 0 1 2
Dimensions without coordinates: sample, feature
Data variables:
    node             (sample, level) object 'Respiratory' ... 'Milk Allergy'
    predicted_class  (sample, level) object 'Respiratory' ... 'Milk Allergy'
    predict_proba    (sample, level, class) float64 0.1 nan nan ... 0.03 nan
    classes          (sample, level, class) object 'Allergy' nan ... nan
    shap_values      (level, class, sample, feature) float64 0.005047 ... nan
from sklearn.ensemble import RandomForestClassifier
from hiclass import LocalClassifierPerLevel, Explainer
import shap
from hiclass.datasets import load_platypus
# Load train and test splits
X_train, X_test, Y_train, Y_test = load_platypus()
# Use random forest classifiers for every level
rfc = RandomForestClassifier()
classifier = LocalClassifierPerLevel(local_classifier=rfc, replace_classifiers=False)
# Train local classifiers per level
classifier.fit(X_train, Y_train)
# Define Explainer
explainer = Explainer(classifier, data=X_train, mode="tree")
explanations = explainer.explain(X_test.values)
print(explanations)
# Let's filter the Shapley values corresponding to the Covid (level 1)
# and 'Respiratory' (level 0)
covid_idx = classifier.predict(X_test)[:, 1] == "Covid"
shap_filter_covid = {"level": 1, "class": "Covid", "sample": covid_idx}
shap_filter_resp = {"level": 0, "class": "Respiratory", "sample": covid_idx}
shap_val_covid = explanations.sel(**shap_filter_covid)
shap_val_resp = explanations.sel(**shap_filter_resp)
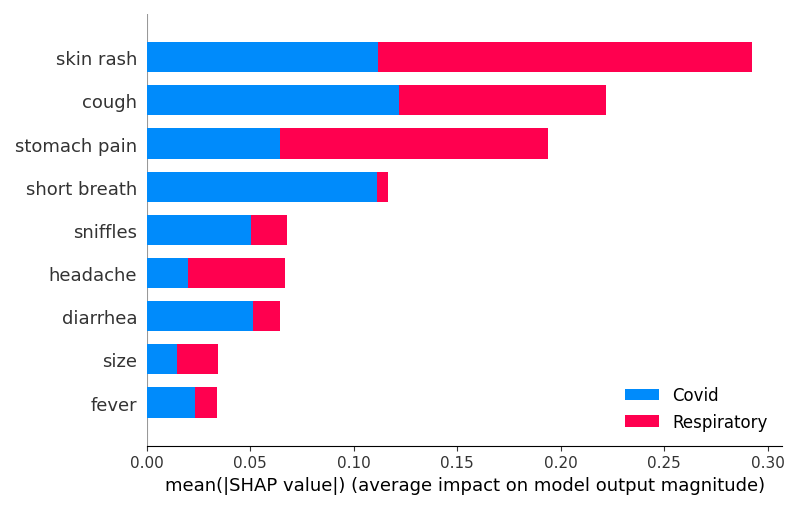
# This code snippet demonstrates how to visually compare the mean absolute SHAP values for 'Covid' vs. 'Respiratory' diseases.
# Feature names for the X-axis
feature_names = X_train.columns.values
# SHAP values for 'Covid'
shap_values_covid = shap_val_covid.shap_values.values
# SHAP values for 'Respiratory'
shap_values_resp = shap_val_resp.shap_values.values
shap.summary_plot(
[shap_values_covid, shap_values_resp],
features=X_test.iloc[covid_idx],
feature_names=X_train.columns.values,
plot_type="bar",
class_names=["Covid", "Respiratory"],
)
Total running time of the script: ( 0 minutes 53.135 seconds)